
Digital Moon Map Aids Astronauts and Scientists
 Fortezzo, Spudis & Harrel (USGS), Public domain, via Wikimedia Commons
The United States Geological Survey has developed a digital map of the moon to assist in future lunar missions. Read on to learn more about the new map.
The details of the moon have excited astronomers since Galileo focused his telescope on the surface in 1610. Science has come a long way from that early telescope. Today, technology has allowed researchers from the United States Geological Survey Astrogeological Center to make a digital map of the moon. What makes a digital map different than previous maps? Let’s find out.
Digital Moon Map
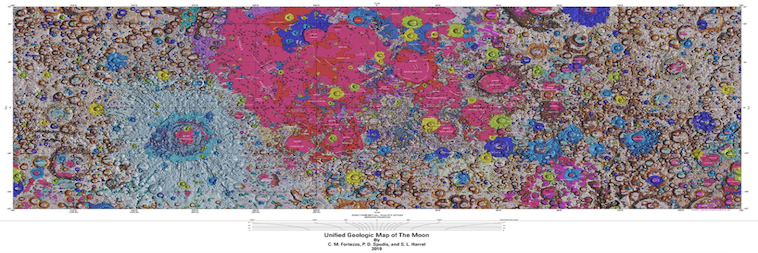
At an impressive scale of 1:5,000,00, the new digital map, called the “Unified Geologic Map of the Moon,” will serve as the definitive blueprint of the moon’s surface geology. Scientists developed it to aid future human missions to the lunar service. In addition, they wanted an invaluable research tool for anyone curious about the moon.
To create the new digital map, scientists used information from six Apollo-era regional maps. In addition, they added updated information from recent satellite missions to the moon. The existing historical maps were redrawn to align them with the modern data sets. However, the cartographers preserved the old maps with previous observations and interpretations. Along with merging new and old data, USGS researchers also developed a universal description of the rock layers. Prior to this, lunar maps had several different key discrepancies regarding the rocks. Sometimes the same rock would have a similar description, but a different name. Furthermore, scientists had different ages for the rocks.
Fortezzo, Spudis & Harrel (USGS), Public domain, via Wikimedia Commons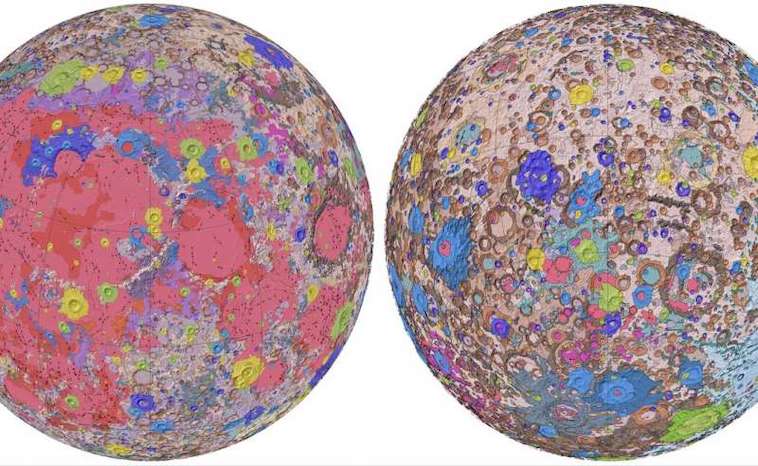
“This map is a culmination of a decades-long project,” said Corey Fortezzo, USGS geologist and lead author. “It provides vital information for new scientific studies. Furthermore, it connects the exploration of specific sites on the moon with the rest of the lunar surface.”
Moon Map Colors
Each splash of color identifies a discrete rock or sediment formation, including craters, basins, and ancient lava fields. For instance, “the darker, more earth tones are these highland-type terrains, and the reds and the purples tend to be more of these volcanic and lava flow materials,” says geologist James Skinner. He oversees the production of standardized maps for solar system bodies at the U.S. Geological Survey in Flagstaff, Ariz.
The color pink dominates the map of the Imbrian era, which occurred some 3.5 billion years ago. During that time, asteroids smashed the moon, creating many of the impact craters we can see on the surface today.
Elevation data for the moon’s equatorial region came from stereo observations. The Terrain Camera collected these observations on the recent SELENE (Selenological and Engineering Explorer) mission. JAXA, the Japan Aerospace Exploration Agency led the mission. NASA’s Lunar Orbiter Laser Altimeter data supplemented the topography for the north and south poles.
Lunar Materials
Having an accurate map will allow scientists to make critical decisions for upcoming trips to the moon. For example, they can determine which areas are best to build lunar structures. Furthermore, they can decide which areas to explore for mining materials. The map can assist them in staying away from areas that may prove dangerous to their lunar vehicles.
Adding color and a well-defined key of information for the new digital moon map is a long overdue gift to astronomers and researchers everywhere. It is a job well done!