Explore the Map of the Observable Universe
After a detailed analysis of 15 years’ worth of data, astronomers have shared a breathtaking map displaying a section of the observable universe. In this article, we’ll tell you everything you need to know about the Map of the Observable Universe and how you can see the relative locations and colour details of around 200,000 galaxies.
In 2000, the Sloan Digital Sky Survey began to take nightly images of the night sky using a 2.5-metre wide-angle telescope positioned in New Mexico, United States. Using data mined from the survey, astronomers from Johns Hopkins University have put together what they call the Map of the Observable Universe. In a challenging endeavour, the architects attempted to transfer as much of the astronomical data captured as possible. They were able to refine their work from a hugely complicated spherical map into a flat, 2D slice representing a selection of the information as simply as possible.
What Does the Map of the Observable Universe Show?
At first glance, the map might look like a confusing jumble of coloured dots. But once you realise what those dots represent, the effect is mind-blowing! The map is a ten-degree night sky slice containing real-world information about 200,000 galaxies. Brice Ménard, a professor at Johns Hopkins University and co-architect of the map (along with computer science student Nikita Shtarkman), said, “This map representing galaxies just as little dots allows the viewer to basically understand different scales at the same time. So, seeing the vastness of the universe, it’s quite inspiring.”
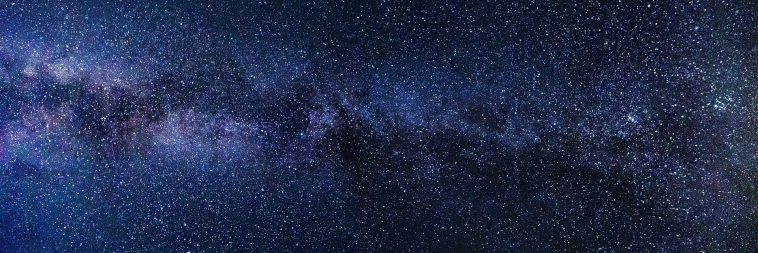
Colours of the Universe
Upon viewing the map, one of the first things you’ll notice is the fantastic colour bands that the dots are primarily grouped into. The colours displayed are the actual colour of the galaxies as viewed from here on Earth and change from blue to deep red. This colour change is because of what we call redshift. Redshift is the term that describes the stretching of visible light wavelengths that occurs the further that light travels. As visible light wavelengths stretch, they turn redder and redder. So generally, the redder an object is, the further away it is.

From Top to Bottom
At the edge of the map, we can see a representation of the Cosmic Microwave Background (CMB), an electromagnetic radiation relic of the first light emitted during the early moments of the universe. The CMB is the edge of our observable universe. We can’t see any objects beyond this point, as they are too far away for their light to reach us – which is also why we appear at the bottom of the map. Our position might give the impression that we are at the centre of the universe. In reality, we are just at the centre of the universe that we can see, as the universe is too big to see any edge it might have. But that’s another story!
")
Pablo Carlos Budassi, CC BY-SA 4.0, via Wikimedia Commons
Pablo Carlos Budassi, CC BY-SA 4.0, via Wikimedia Commons.png)
From Galaxies to Stars
After you’ve spent time exploring the mesmerising Map of the Observable Universe, check out the OSR Star Finder App to learn more about some of the stars found within the galaxies.